Website building tool
Redesigned a configuration panel to drive a 133% increase in task completion
Redesigned a configuration panel to drive a 133% increase in task completion
Redesigned a configuration panel to drive a 133% increase in task completion
Role
Role
UX Designer
UX Designer
/
Year
Year
2025
2025
/
Duration
Duration
4 months
4 months
Redesigning a critical internal control panel to reduce cognitive load and enable non-technical users to build brand-aligned websites independently.

Problem
Inefficient workflows and scaling operational costs
Inefficient workflows and scaling operational costs
The legacy interface had a flat hierarchy of technical parameters, forcing users to scan through 20+ settings to perform a single task. This resulted in a high interaction cost and increased the probability of configuration errors.
The legacy interface had a flat hierarchy of technical parameters, forcing users to scan through 20+ settings to perform a single task. This resulted in a high interaction cost and increased the probability of configuration errors.
Solution
A consistent panel built for speed and accuracy
A consistent panel built for speed and accuracy
Implementing a unified layout and consistent taxonomy across the design panel eliminated navigational friction, reducing task duration and improving the experience for the user.
Implementing a unified layout and consistent taxonomy across the design panel eliminated navigational friction, reducing task duration and improving the experience for the user.
Objectives
Optimise the core task path, translating directly into time and labor cost savings for the business. (Task efficiency)
Simplify labels to minimise the mental effort required to complete core tasks and ensure a reliable outcome.(Cognitive load & Errors)
Improve understanding, enabling users to leverage the full power of the tool beyond basic tasks. (Learnability & Advanced usage)

Discovery
Inconsistent design panel obstructed the user’s ability to understand and utilise key functionality
Inconsistent design panel obstructed the user’s ability to understand and utilise key functionality
My research revealed that users navigate the tool by intent. A user doesn't set out to adjust a hex code, they set out to change the appearance of a page. I needed to match the tool to our user's mental model.
Restructuring the panel layout to align with user intent would increase ease of use and task completion rates. For the business, this translates to lower operational costs (fewer support tickets) and significantly higher workflow efficiency.
Clear panel layout → Increased ease of use → Increased Task Completion Rate → Reduced operational costs → Increased efficiency
Key findings
Key findings
Disorganised layout. Unclear labels and inconsistent layout added minutes to basic tasks.
Disorganised layout. Unclear labels and inconsistent layout added minutes to basic tasks.
Unclear system feedback. Lack of clear feedback increased confusion and support inquiries.
Unclear system feedback. Lack of clear feedback increased confusion and support inquiries.
High cognitive load. Reliance on memory for key workflows led to frequent mistakes and rework.
High cognitive load. Reliance on memory for key workflows led to frequent mistakes and rework.
Design
Standardising the controls panel through a systematic redesign that prioritised findability and mirrored user intent
Standardising the controls panel through a systematic redesign that prioritised findability and mirrored user intent
The legacy interface functioned as a collection of settings rather than a tool. My primary goal was to re-design the interface to prioritise scanning speed and the creative work flow.
Streamlining the Information Architecture. I restructured the overwhelming list of settings into logically grouped categories (Fig. 1). This semantic grouping significantly reduced cognitive load and immediately established a predictable workflow. Further, renaming ambiguous settings (e.g., 'Variant' to 'Text style') minimised user guesswork, directly reducing time wasted.
Streamlining the Information Architecture. I restructured the overwhelming list of settings into logically grouped categories (Fig. 1). This semantic grouping significantly reduced cognitive load and immediately established a predictable workflow. Further, renaming ambiguous settings (e.g., 'Variant' to 'Text style') minimised user guesswork, directly reducing time wasted.

Fig.1 Organising settings into logical, predictable groups established a consistent, scannable layout that reduced user guesswork.
To ensure we built the best solution possible within the CMS constraints, I evaluated three distinct strategies for managing the panel's complexity. We determined that splitting breakpoints (Fig 2.1) introduced too much cognitive friction for users, offsetting the potential reduction in error rate.
I immediately moved away from progressive disclosure pattern (Fig.2.2), recognising that hiding functionality would actively undermine the goal of increasing Advanced Feature Usage.
I therefore suggested we move forward with the strategy of combining settings (Fig.2.3), ensuring that any simplification maintained the necessary granularity for power users while reducing the total number of options presented.

Fig.2.1 Splitting ‘global’ and ‘local’ breakpoints to reduce rework
Pro: Eliminates accidental re-work
Con: New mental model increasing training costs
Fig.2.1 Splitting ‘global’ and ‘local’ breakpoints to reduce rework
Pro: Eliminates accidental re-work
Con: New mental model increasing training costs

Fig.2.2 Complex settings into an “advanced” tab to reduce cognitive load
Pro: Declutter for moderate users
Con: Hides crucial settings for advanced users
Fig.2.2 Complex settings into an “advanced” tab to reduce cognitive load
Pro: Declutter for moderate users
Con: Hides crucial settings for advanced users

Fig.2.3 Combining settings that do similar things for simplicity
Pro: Reduces number of options presented
Con: Sacrificing granularity and future conflicts
Fig.2.3 Combining settings that do similar things for simplicity
Pro: Reduces number of options presented
Con: Sacrificing granularity and future conflicts
Navigating technical trade-offs. A core goal for improving understanding was to give users confirmation of settings they adjusted.
Challenge. Explicitly displaying these default values required hardcoding on the front-end. This rigidity would introduce technical debt, forcing separate front-end updates for every back-end change, sacrificing future development velocity.
Solution. I collaborated closely with the development team to implement a subtle "default value" label. This approach saved the team an estimated three weeks of engineering time. (Fig.3)
Strategic benefits
Strategic benefits
Engineering Win: No front-end code change needed for back-end default updates, maximising development velocity.
Engineering Win: No front-end code change needed for back-end default updates, maximising development velocity.
Business Win: Accelerated Time-to-Market by by reallocating resources to ship new features.
Business Win: Accelerated Time-to-Market by by reallocating resources to ship new features.
User Win: A more reliable system with a consistent flow of innovation.
User Win: A more reliable system with a consistent flow of innovation.
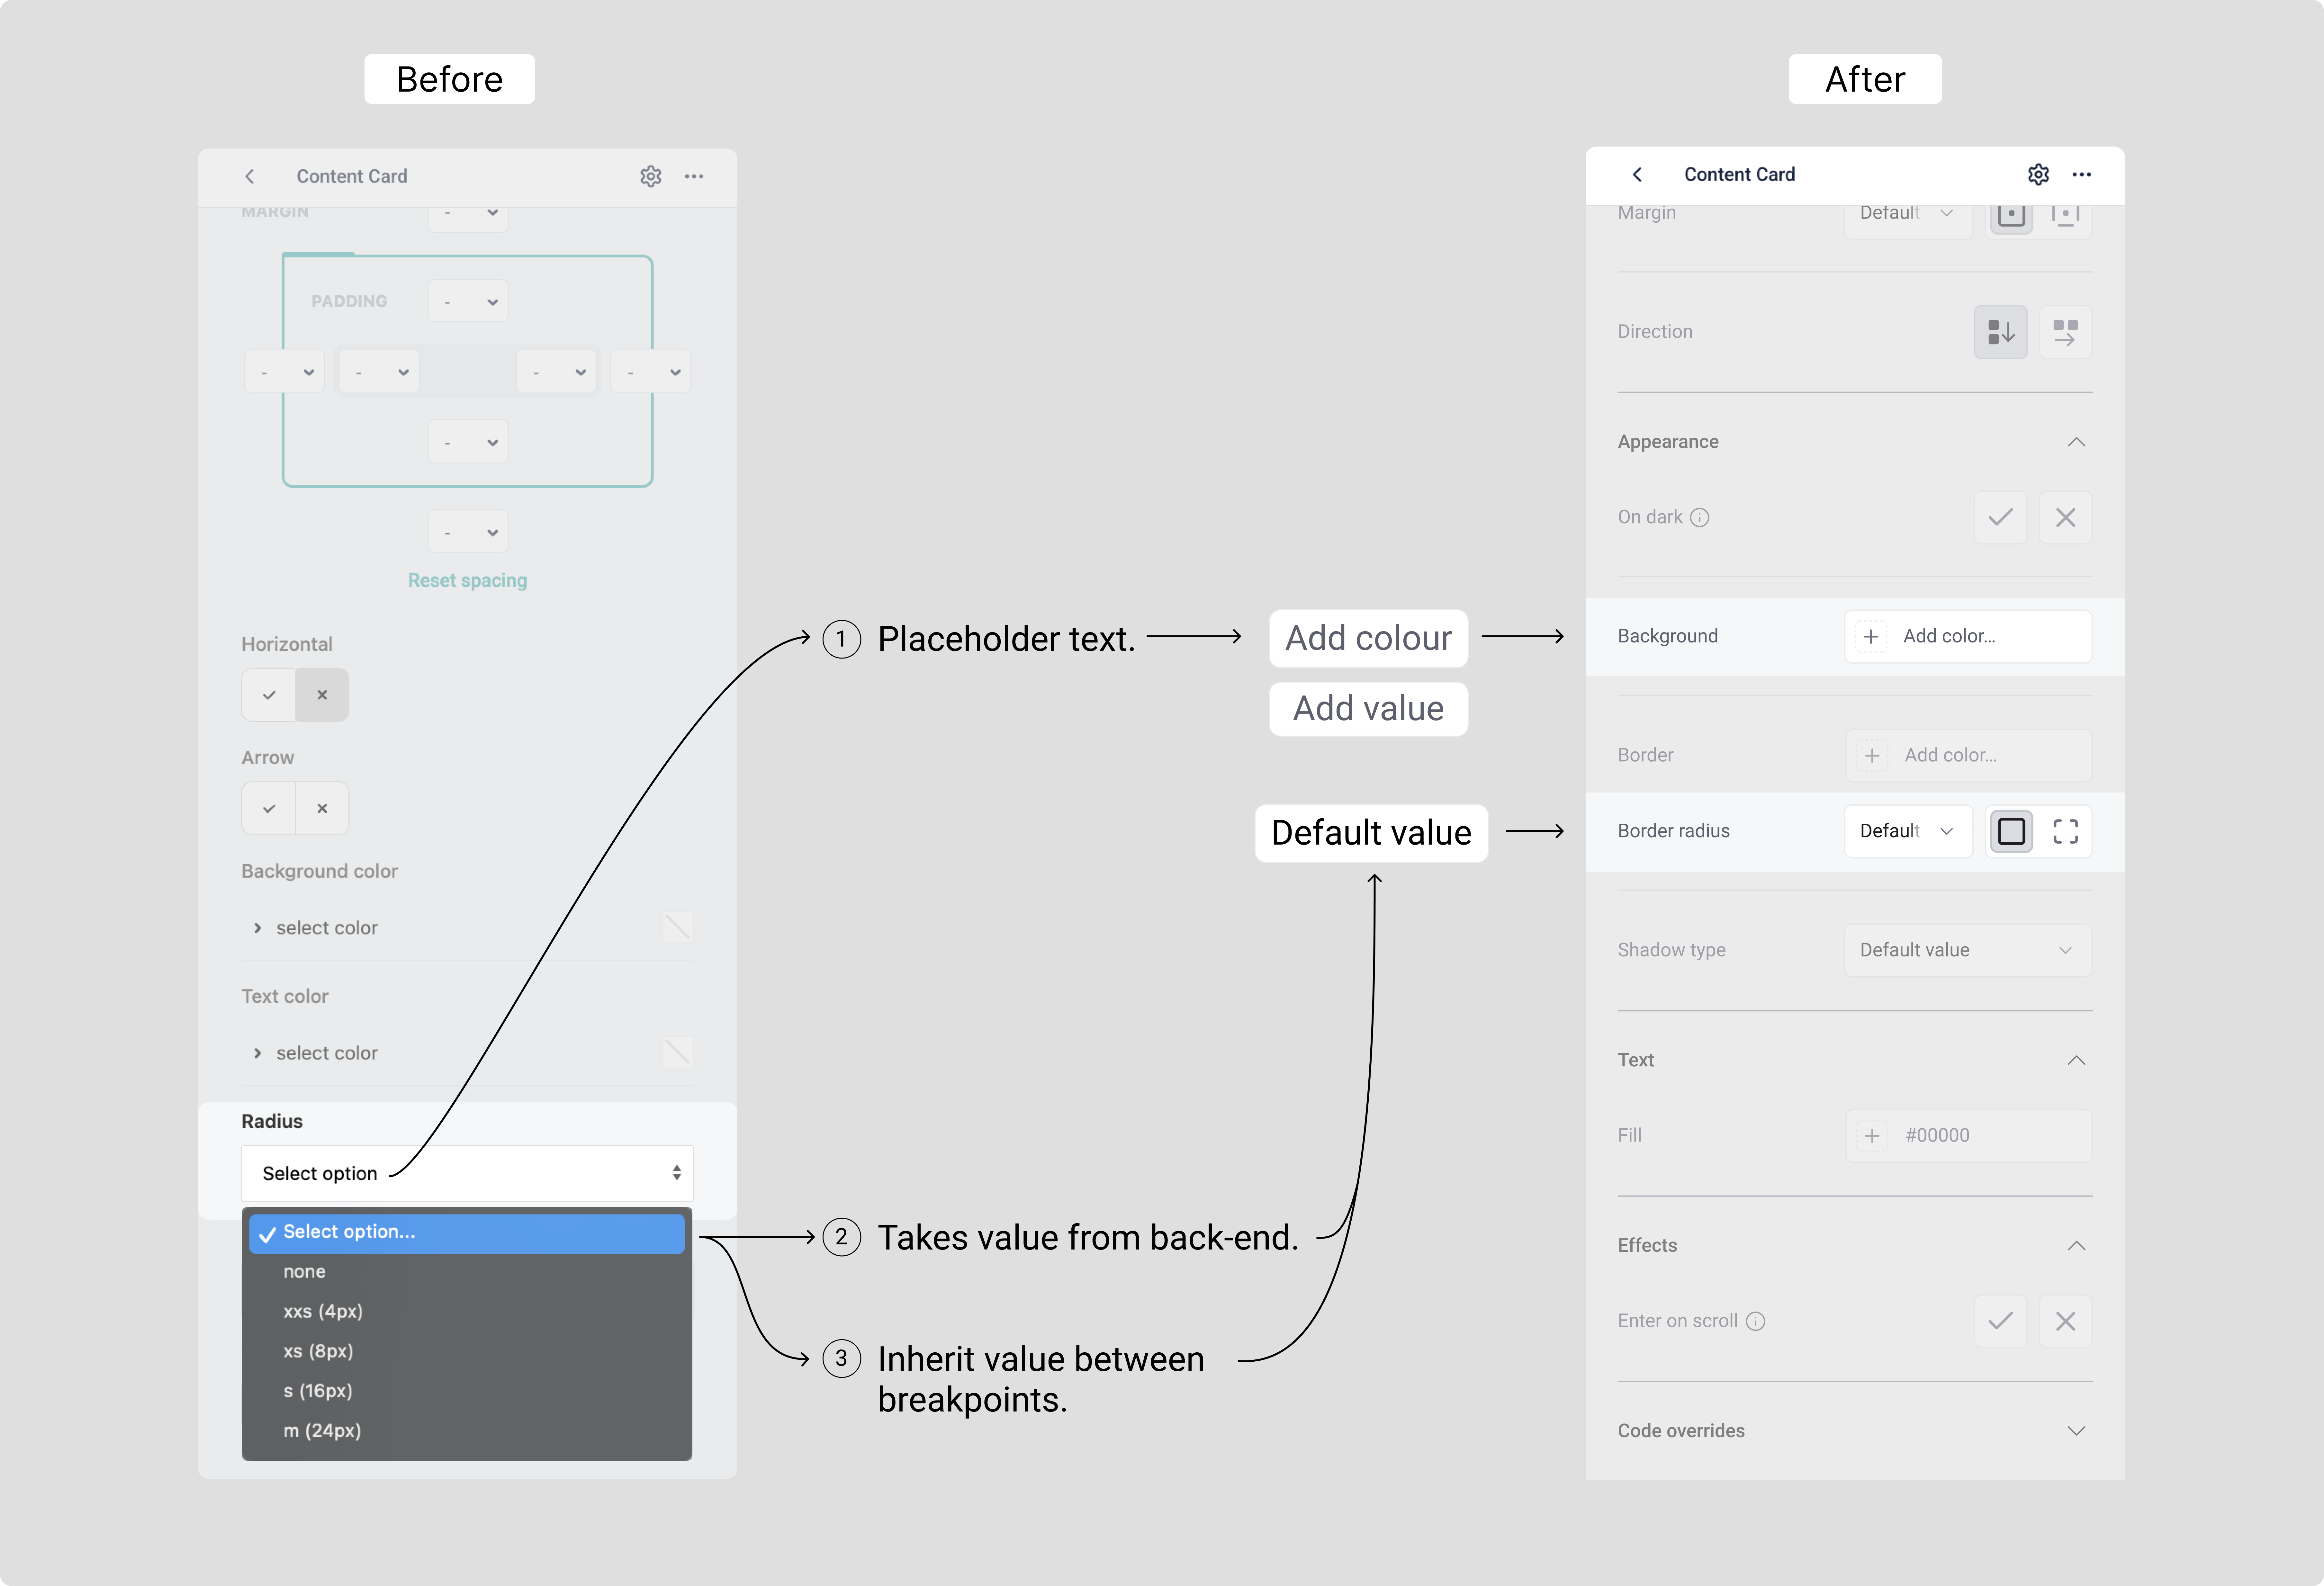
Fig.3 Mitigating technical debt. This subtle design choice saved 3 weeks of engineering labor, directly contributing to the project's cost-saving objective.
Testing
Completion rate increased significantly and participant feedback was overwhelmingly positive
Completion rate increased significantly and participant feedback was overwhelmingly positive
Validation testing confirmed the success of the new logic, with participants describing the redesigned panel as 'considered,' 'smooth,' and 'a pleasure to use.'
However, testing also revealed a secondary challenge in the weight of legacy habits. To mitigate this, I integrated legacy icons as visual anchors, creating a memory bridge for power users, easing the transition to the more efficient panel without sacrificing their speed.
Following the redesign, I conducted a second task-based usability study to validate the design's ROI and mitigate launch risk. Participants described the new panel as "considered," "smooth," and "a pleasure to use".
The TCR for the key task (editing a section with flex layout) increased by 43%. Further for participants who previously completed the task saw a 9% reduction in time to completion.
I noted some users preferred old suboptimal settings due to habit, stressing the necessity of careful change management and avoiding unnecessary disruption to established workflows.
Key metrics
Key metrics
133% increase in Task Completion Rate (TCR)
17% reduction in Time on Task (ToT)
6% increase in Perceived Ease of Use (PEoU)
Impact
Productivity surged as the new panel delivered a 133% increase in task completion
Productivity surged as the new panel delivered a 133% increase in task completion
Validation testing confirmed a significant shift in performance with a 133% increase in task completion and a 17% reduction in time on key tasks. By using legacy icons as a memory bridge, the transition remained frictionless, reflected in a 6% boost in perceived ease of use. The new panel successfully aligns technical power with user intent, proving that a 'considered' interface is a more productive one.
Beyond immediate performance gains, the redesign established a foundation for long-term organisational efficiency.The 133% surge in task completion will reduce the number technical support queries. Furthermore, by establishing a standardised component taxonomy, the redesign will accelerate implementation cycles paving the way for automated schema alignment and reclaiming high-value labor hours for the engineering team.
↑ increase in task completion
↓ reduction in time on a task
↑ increase in perceived ease of use
Retrospective
Prioritising behavioural data over stated preferences.
Prioritising behavioural data over stated preferences.
Interviews provided what users said, but task observation revealed what users did, exposing the true cost drivers. This validated our decision to focus on quantitative metrics, not just satisfaction scores.
Interviews provided what users said, but task observation revealed what users did, exposing the true cost drivers. This validated our decision to focus on quantitative metrics, not just satisfaction scores.
Embedding technical feasibility in the design process
Embedding technical feasibility in the design process
Close collaboration led to a major win where we balanced user outcomes without introducing technical debt, saving an estimated 3 weeks of engineering time (Fig. 3). This proactive approach ensures design decisions accelerate, rather than impede, development velocity.
Close collaboration led to a major win where we balanced user outcomes without introducing technical debt, saving an estimated 3 weeks of engineering time (Fig. 3). This proactive approach ensures design decisions accelerate, rather than impede, development velocity.